
Report · November 2026 · Climate Council × Carbon Zero Initiative
Pollution Pipeline
Australia’s dirtiest data centre proposals could pollute as much as our dirtiest coal power stations
A report by the Climate Council and Carbon Zero Initiative
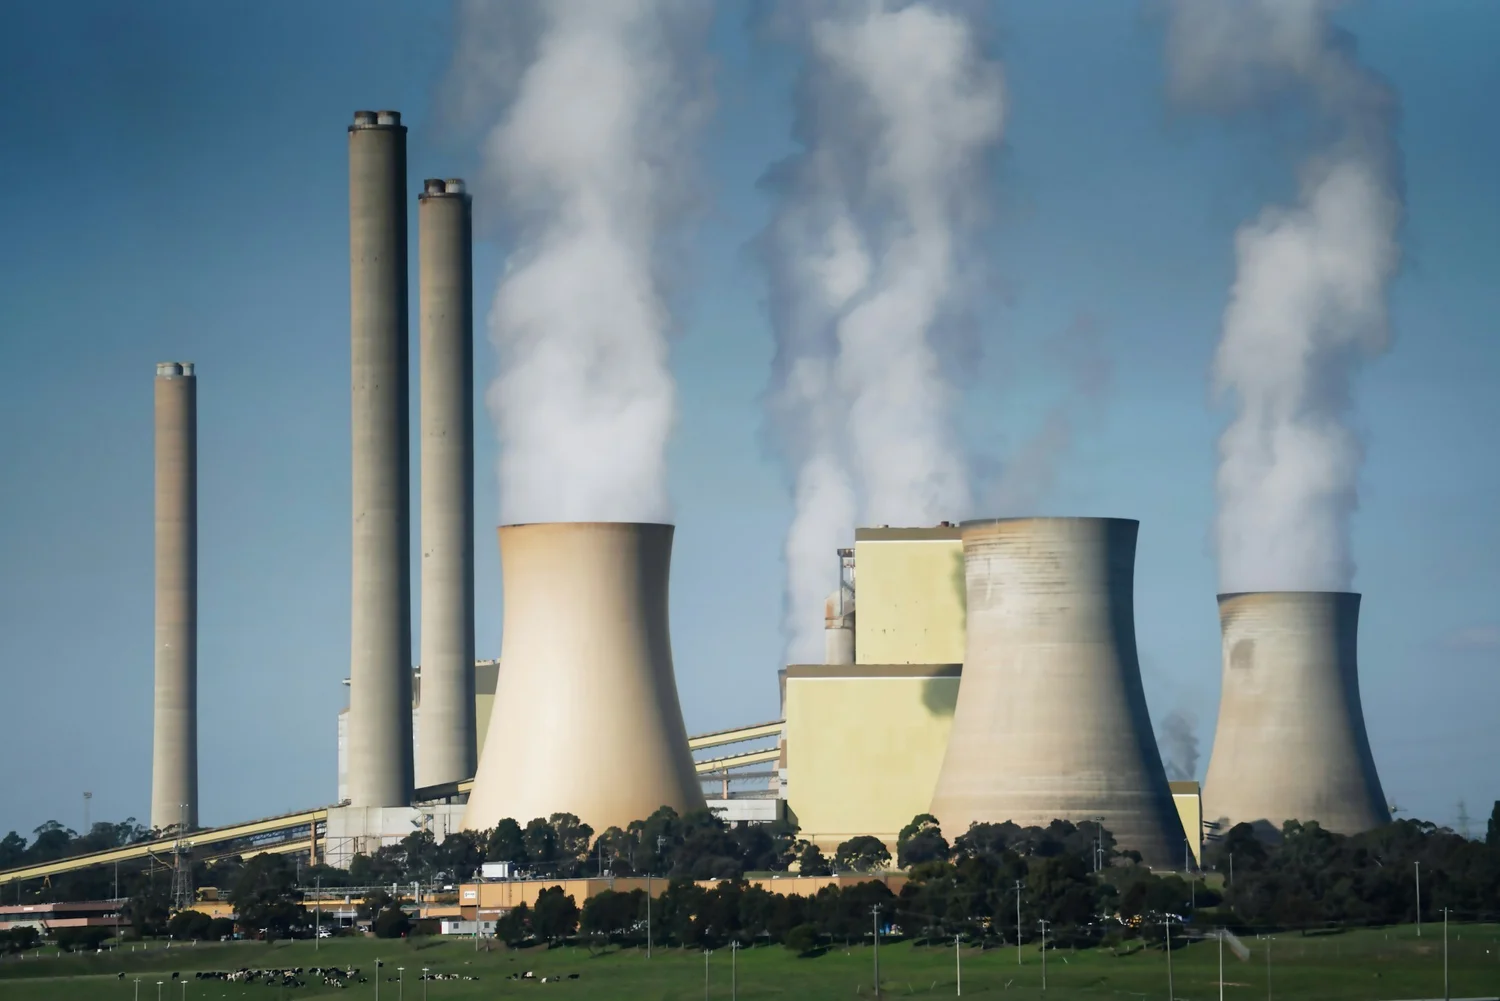
Renewables and storage now supply more than 45% of electricity in our main grid. Data centres can build on that progress or undo it, and how they are powered decides which. Their impact depends on whether they bring their own new wind, solar and storage, or draw on the existing grid and burn gas.
The numbers
- 39.7Mt million tonnes (Mt) of climate pollution a year by 2035 from just nine data centre proposals, if not matched with new renewables and storage
- 51.7TWh of grid electricity these projects could use each year by 2035 – more than two-thirds of what all Australian homes use
- 225 data centres lined up to connect to the main grid – more than double a year ago
- 20% modelled rise in average wholesale power prices across the main grid by 2035 if data centre demand isn’t matched with new renewables and storage Source: Baringa
Nine proposals, as much pollution as our dirtiest coal stations
If they don’t bring new renewables and storage to match their demand, just nine data centre proposals could add 39.7 Mt of CO₂-e a year by 2035 – almost as much as Australia’s three most polluting coal power stations combined. In Victoria, three proposals together could add 17.7 Mt a year, more than Loy Yang A, Australia’s most polluting coal power station. In New South Wales, four proposals could together add 10.2 Mt a year, more than 1.5 times as much as Vales Point. In Queensland, the Western Downs proposal alone could add 8.3 Mt a year, more than Stanwell.
Annual pollution, three most polluting coal stations vs nine data centre proposals (Mt CO₂-e)
Annual pollution in 2035 if not matched with new renewables (Mt CO₂-e)
- Grid-powered
- On-site gas (striped)
Some developers want Australia’s biggest gas power stations
Gas supplies a small and shrinking share of our main grid. Yet several data centre developers, some with direct ties to the gas industry, want to build off-grid gas power stations bigger than any operating in Australia today.
- Beetaloo Digital (NT) plans up to 2 gigawatts (GW) of gas generation, fed by its parent company’s fracked gas.
- Project Meridien (WA) plans 1.5 GW of gas generation, about twice the size of the biggest gas power station operating today.
- Project Ares (NT) would start on a 1 GW gas plant.
- Globally, 181 GW of new gas generation is proposed alongside data centres, and more than 90% of it is in the US.
Cheapest new-build cost per megawatt hour (MWh)
- Solar $52–88 per MWh
- Onshore wind $78–129 per MWh
- New gas $131–192 per MWh
Source: CSIRO GenCost 2025–26.
Once funded, solar takes 21 months on average to build and wind about 30 months, while waiting lists for new gas turbines stretch five years or more.

Risks to power bills, industry and water
-
Bills
Higher wholesale prices
If data centre demand isn’t matched with new renewables and storage, wholesale prices could rise 20% across the main grid by 2035 – 26% in NSW and 23% in Victoria. Data centres run around the clock, so they need new storage from day one, or homes and businesses foot the bill.
-
Industry
Manufacturers outbid
Tomago, Australia’s largest energy user, needed $2.5 billion in government support for high energy costs. Data centres with deep pockets could outbid industries like it when their power contracts end.
-
Water
Pressure on supplies
Sydney Water forecasts data centres could take 15–20% of Sydney’s water supply by 2035. If water efficiency doesn’t improve, data centre water demand could reach 47 billion litres a year in 2035–36.
Our recommendation
What the national standards must do
At a minimum, the national standards must:
- Match at least 100% of demand with genuinely new renewables and storage, with storage from day one
- Build the new supply within three years, with real penalties
- Rule out gas as a primary power source, including when it is labelled “firming”
- Make recycled water the standard for cooling, and ban fresh water for cooling in water-stressed regions
- Cover every data centre over 30 MW that starts operating after 23 March 2026, everywhere in Australia
43.6 GW of approved renewable projects are waiting for buyers – more than enough for forecast data centre growth.

Read the report
Pollution Pipeline identifies the nine Australian data centre proposals that could add the most climate pollution if they don’t bring new renewables and storage, and the developers planning Australia’s biggest gas power stations. It sets out what the national standards for AI and data centres must do to protect our climate, water supplies and power bills.
A report by the Climate Council and Carbon Zero Initiative. Published by the Climate Council, with analysis by Carbon Zero Initiative.
Key terms
- Gigawatt (GW)
- A unit of power equal to 1,000 megawatts (MW). It describes how much electricity a power station can produce, or a data centre can draw, at any one moment.
- Terawatt hour (TWh)
- A unit of energy equal to one billion kilowatt hours. It measures how much electricity is used or produced over time, such as a year.
- Mt CO₂-e
- Million tonnes of carbon dioxide equivalent. A measure of climate pollution that counts all greenhouse gases by their warming effect compared with carbon dioxide.
- Firming
- Supply that fills the gaps when wind and solar output is low, such as batteries. Some developers label large new gas power stations as “firming”.
- Main grid (National Electricity Market)
- The connected grid covering Queensland, New South Wales, the ACT, Victoria, South Australia and Tasmania. It does not include Western Australia or the Northern Territory.
- Utilisation rate
- The share of its maximum power demand a data centre uses on average. The report assumes 50%, in line with the Australian Energy Market Operator (AEMO); AI training facilities are expected to run at around 80%.
More on data centres
-
Briefing note
Running on Reserve
How data centres risk burning gas reserved for Australian homes and businesses.
-
Report
Site it Right
Matching data centre demand with curtailed renewable energy in NSW.
-
Joint Statement
Public Interest Principles for Data Centres
Our joint statement on how data centres can serve the public interest.
References · Clean Energy Regulator (2026) Electricity sector emissions and generation data 2024–25 · AEMO (2026) Electricity Statement of Opportunities · Baringa and CEFC (2025) Getting the balance right · CSIRO (2026) GenCost 2025–26 · Clean Energy Council (2026) Clean Energy Australia Report · IEEFA and Green Energy Markets (2026) Australian Renewable Energy Scorecard · WSAA (2025) Data centres and water in Australia · BloombergNEF (2026)